
This is the final and probably most important part of the making of any native extension. You need to be able to step through both your ActionScript, as well as native code, in this case C++. See how to do that below.
At the end of this part you will have:
Ran and stepped through the native code of your ANE in Visual C++. And you will have completed this tutorial. 
Time
15-20 minutes![]()
Wait, have you done this first?
- Part 1: The native DLL project, 8-10 minutes
- Part 2: The Native DLL code, 10-15 minutes
- Part 3: Set up the AIR Library – 8-10 minutes
- Part 4: Packaging the ANE – 10-12 minutes
- Part 5: Testing the ANE – 12-15 minutes
Step 1: Automate the ANE build process
What you ultimately want, when you are developing a native extension, is that any changes you make in the ANE are there every time you run your test app. This makes for a very long process if you have to package your ANE by hand every time you change a line of code in it.
You can, on the other hand, put together build scripts that do all the work for you and rebuild the ANE every time you run the app in the debugger. This means that you can have a normal build environment: do a small change, run in the debugger to step through it, do another small change… you get the idea.
Here are a couple of articles that show you how to automate your ANE build and packaging (+ you can get ready build scripts there):
Step 2: Automate the app build process
You are in luck on Windows. On platforms like iOS and Android you need another build script for your app to trigger the ANE build and install the app on your device.
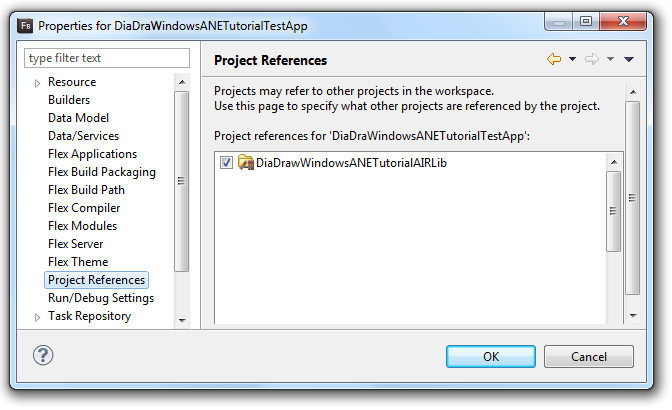
Here you just need to tell Flash Builder that your app references the AIR lib you set up in Part 3: Set up the AIR Library. Open your Flash Builder project Properties, go to Project References and tick the box next to the AIR library (DiaDrawWindowsANETutorialAIRLib, if you have been following the naming convention in the tutorial):
Step 3: Check your Visual C++ project settings
Open your project’s Properties in Visual C++ and apply the following:
- In C/C++ > General:
- Debug Information Format: Program Database (/Zi)
- Common Language RunTime Support: Common Language RunTime Support (/clr)
- In C/C++ > Code generation:
- Enable C++ Exceptions: Yes with SEH Eceptions (/EHa)
- Runtime Library: Multi-threaded Debug DLL (/MDd)
- Basic Runtmie Checks: Default
- In C/C++ > Precompiled Headers:
- Precompiled Header: Not Using Precompiled Headers
- In C/C++ > Advanced:
- Calling Convention: leave blank
Step 3: Run the app in the Flash Builder debugger
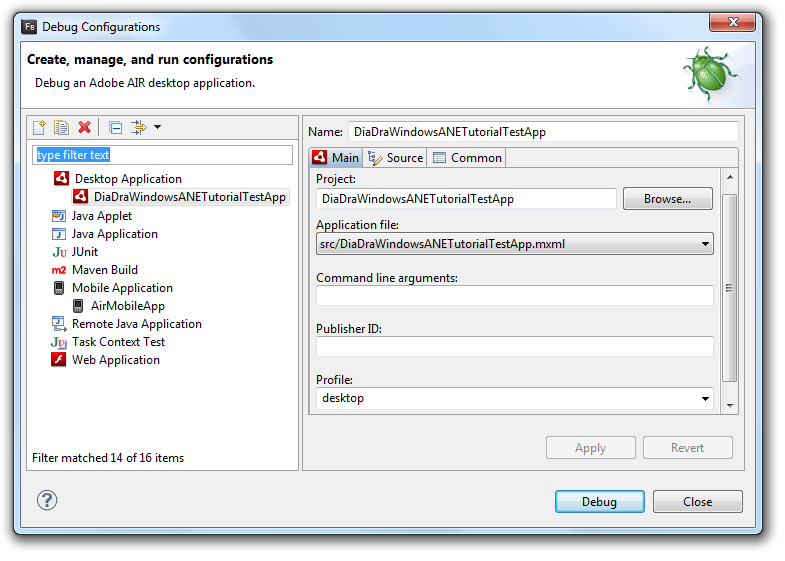
Set up a debug configuration for your project (Run > Debug Configurations) and hit Run > Debug.
Step 5: Attach the Visual C++ debugger
Here comes the fun bit.
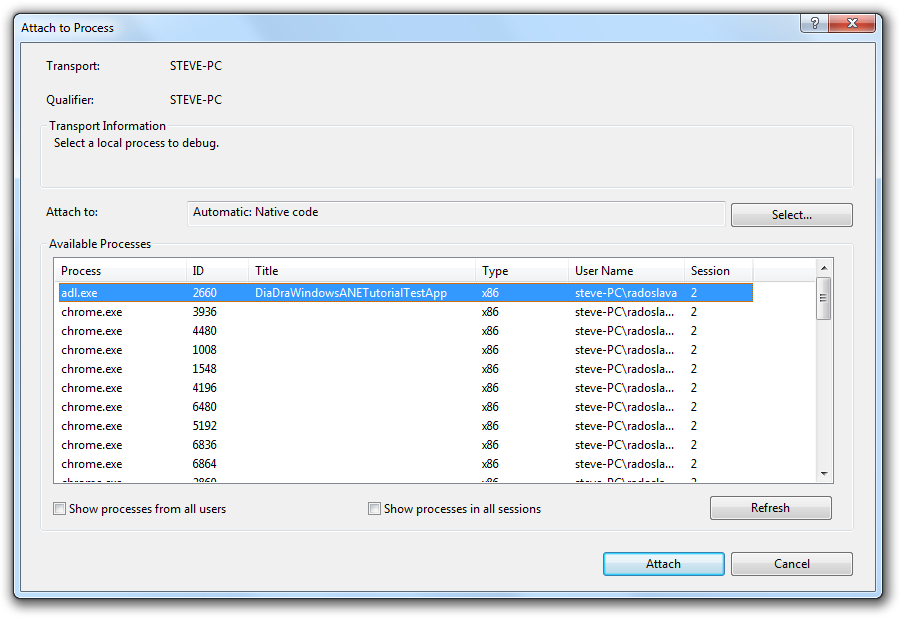
In Visual C++ select Debug > Attach to Process…

In the list of processes you see select adl.exe. This is the Adobe Debug Launcher that provides a run-time for your app and allows it to be executed without having to be packaged into an .exe:
 At this point, if you try and set breakpoints in your C++ code, you may encounter the following warning:
The breakpoint will not currently be hit. No symbols have been loaded for this document.
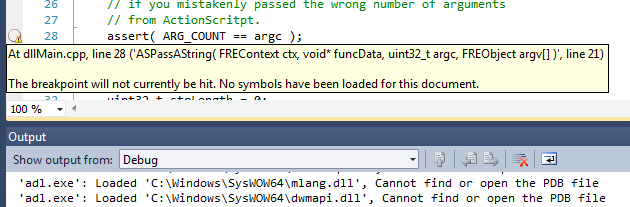
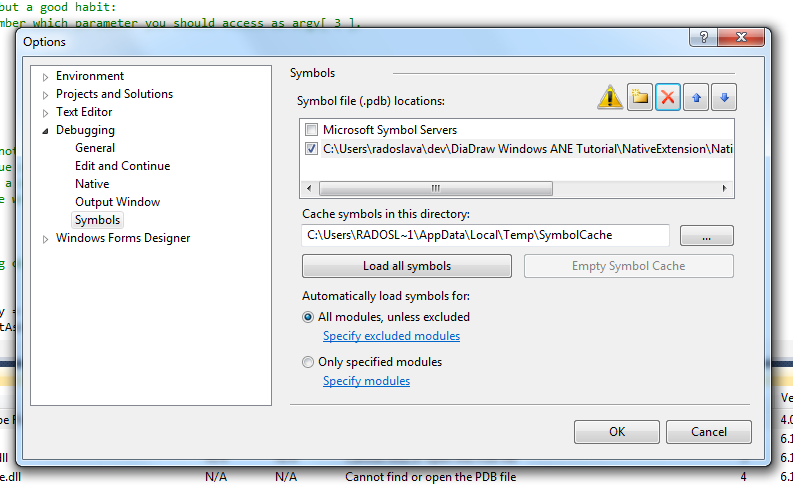
This happens because ADL copies, unpacks your ANE and runs its code from a Windows system folder. In that folder the C++ debugger finds only your DLL, but not any debug information. The information about debug symbols is usually found in a .pdb file in the folder where you build your DLL (in my case DiaDraw Windows ANE Tutorial\NativeExtension\NativeLibrary\win\DiaDrawWindowsANETutorialDLL\Debug).
Tell the debugger where to find the .pdb: from the main menu in Visual C++ select Debug > Options and Settings > Symbols. Add the path to your .pdb file under Symbol file (.pdb) locations, then hit Load all symbols.
Now put your breakpoints in. Note: if you are still seeing the warning above, restart Visual C++, rebuild your projects (ANE + app) and try again. If you select Debug > Windows > Modules and locate the native library DLL in the list of modules, you should see Symbols loaded under Symbol Status:

Finally you can step through your code:
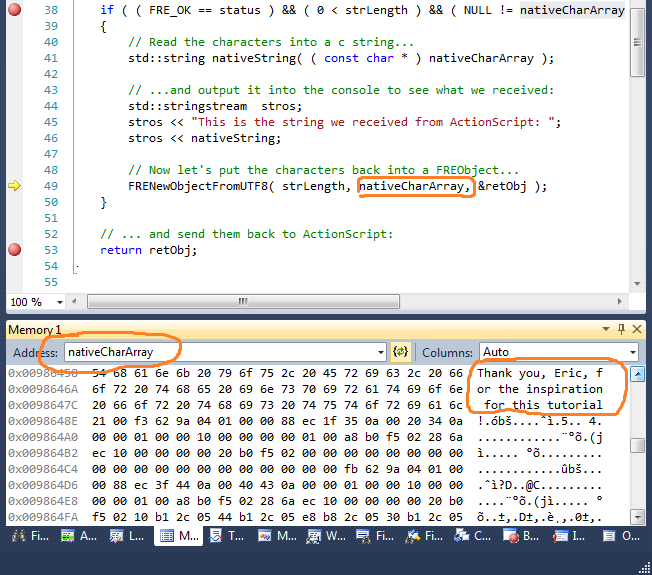
And you know what the best bit is? You can debug your ActionScript code at the same time, because you are running the app in the Flash Builder debugger too!
Things to keep in mind
- When you are changing code in your ANE, whether it’s the native C++ code or the ActionSript side, both your ANE and the app you are using it in will need to be rebuilt for the changes to take effect.
- Visual C++’s debugger caches the debug symbols you tell it to load. This can sometimes cause the debugger to get out of synch with what you are running. Reloading the symbols usually helps. Restarting Visual C++ also often helps it come to its senses.
What else?
- See the table of contents for the tutorial, in case you want to jump back or ahead.

Buy any Easy Native Extensions 2nd Edition package and get our $99 iOS + Android ANE Template completely free before the end of June 2015.
- step-by-step guide to making your iOS extension in under an hour
- library for data conversion between ActionScript and native code
- tutorials
- infographics
- code included
Leave a Reply